The scatterplot shows the relationship between x and y. A line of best fit is also shown. SAT Math Prep
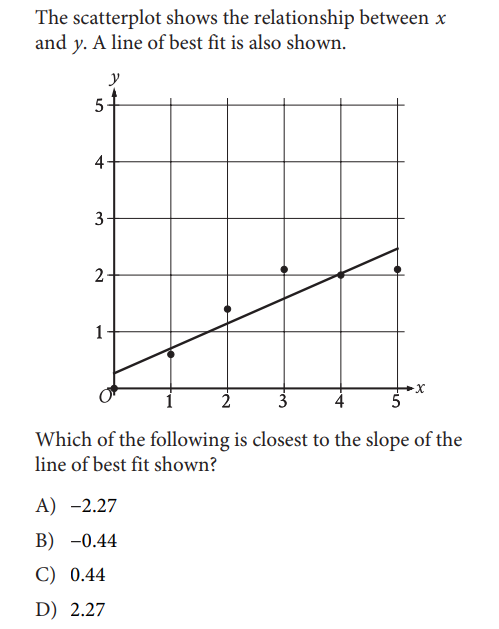
The scatterplot shows the relationship between x and y. A line of best fit is also shown. Which of the following is closest to the slope of the line of best fit shown?
A) −2.27
B) −0.44
C) 0.44
D) 2.27
Answer
We can rule out Option A and B because we know when the line slopes upwards (right side is up, left side is down) the gradient (or slope) is positive.
Next, we choose between Option C and D.
To find the gradient of this line, choose any 2 points on it. These will be (x1, y1) and (x2, y2). Next, plug them in the following formula:
Gradient = (y2-y1)/(x2-x1)
For ease of calculation, we choose points that are on the grid.
(4, 2) and (0, 0.25)
Next, add them to the formular for gradient.
Gradient = (y2-y1) / (x2-x1)
Gradient = (2 – 0.25) / (4 – 0)
Gradient = 1.74 / 4
Gradient = 0.437, which is close to 0.44.
The correct option is C
Tip: If you don’t have time to calculate the gradient using this formula, just estimate the gradient. You can see for each unit x moves left, the y value moves about 0.5 units upward. This is close to 0.44 (and not at all close to 2.27) so again, the correct answer is C. The gradient of any straight line is determined using this formula:
Boost your SAT score by going through these SAT test questions and easy solutions. If you need help with a question, leave a comment below!